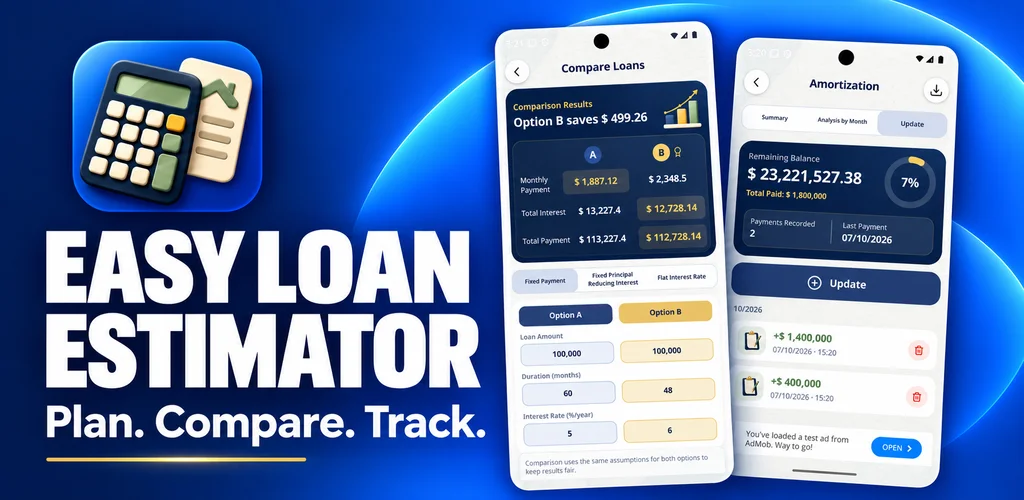
Loan calculators tend to look like spreadsheets: enter four numbers, get a table with hundreds of rows. Everything is there, and almost nobody can tell at a glance whether they can afford the loan. This post walks through one worked example to show how Loan Estimator presents the same maths as an answer.
The example
- Amount borrowed
- 200,000
- Interest rate
- 6% a year, fixed
- Term
- 30 years, paid monthly (360 payments)
The maths behind it
Monthly payment for a fixed-rate loan comes from the standard amortization formula, where P is the amount, r the monthly rate and n the number of payments.
With r = 0.06 ÷ 12 = 0.005 and n = 360, that gives a monthly payment of about 1,199.10.
Answer first
The result screen leads with three numbers, in this order, before any table:
Seeing that the interest is larger than the loan itself is the moment most people actually understand what they are signing up for. A table of 360 rows hides that; three numbers make it obvious.
Detail second
The full schedule is one tap away. Its first rows show why early payments barely reduce the balance:
| Month | Interest | Principal | Balance |
|---|---|---|---|
| 1 | 1,000.00 | 199.10 | 199,800.90 |
| 2 | 999.00 | 200.10 | 199,600.80 |
| 3 | 998.00 | 201.10 | 199,399.71 |
Comparing scenarios
Most people are deciding between two versions of a loan, not whether to take one. Saved scenarios sit side by side with the differences written out.
30 years
- 1,199.10 a month
- 231,676 total interest
- 431,676 paid back
15 years
- 1,687.71 a month (+488.61)
- 103,788 total interest
- 303,788 paid back (−127,888)
Comparison is where the decision happens, so it should not need a calculator of its own.
Reports for the conversation that follows
A loan decision rarely happens alone. The export creates a PDF with the inputs, the three headline numbers and the full schedule, so a partner or adviser starts from the same page.